BACK
PhantomBuster
Reducing Churn Through Guided Discovery at Phantombuster
Overview
Company: Phantombuster, a B2B SaaS platform that helps sales and marketing teams automate lead generation, outreach, and data enrichment across LinkedIn, Google, Instagram, and other platforms.
My role: Lead Product Designer
Team: Cross-functional product team (PM, engineering, data, CS)
Timeline: ~6 months (Oct 2025 – Mar 2026)
Impact: 9.4% reduction in weekly plan cancellations, MRR stabilized at ~€1M
The Problem
Phantombuster was experiencing a steady stream of churn, roughly 460 plan cancellations per week, putting pressure on a monthly recurring revenue base of approximately €1M. For a SaaS business where the core plans (Starter, Pro, Team) account for over 93% of revenue, every churned user represents compounding revenue loss.
The company needed to understand why users were leaving and find product-led ways to retain them.
Discovery & Research
Quantitative signals
I partnered with our data team to analyze churn patterns in Amplitude. The cancellation survey data revealed a clear hierarchy of reasons:
"Don't need it anymore": the #1 reason, accounting for the largest share of cancellations
"Just taking a break": nearly as common, suggesting users saw the product as disposable rather than essential
"Pricing": the third most cited reason, pointing to a perceived value gap
"Didn't find what I needed" and "Complexity": smaller but significant, suggesting discoverability and usability barriers
The first two reasons stood out: they weren't about bugs or competitor products; they were about value perception. Users simply weren't finding enough ongoing reason to stay.
The second automation insight
Digging deeper into our activation and retention data, we identified a powerful correlation: users who set up a second automation ("phantom") shortly after their first one had significantly higher Customer Lifetime Value, stayed subscribed longer, and generated fewer support tickets.
This made intuitive sense. A user who runs one LinkedIn scraper might get what they need and leave. But a user who connects that scraper to an outreach automation has built a workflow, they've integrated Phantombuster into their process rather than using it as a one-off tool.
The second phantom was our retention lever.
Qualitative research
To understand the why behind the data, I conducted user interviews and usability sessions with both churned users and active power users. Key findings:
New users often didn't know what else Phantombuster could do after setting up their first automation
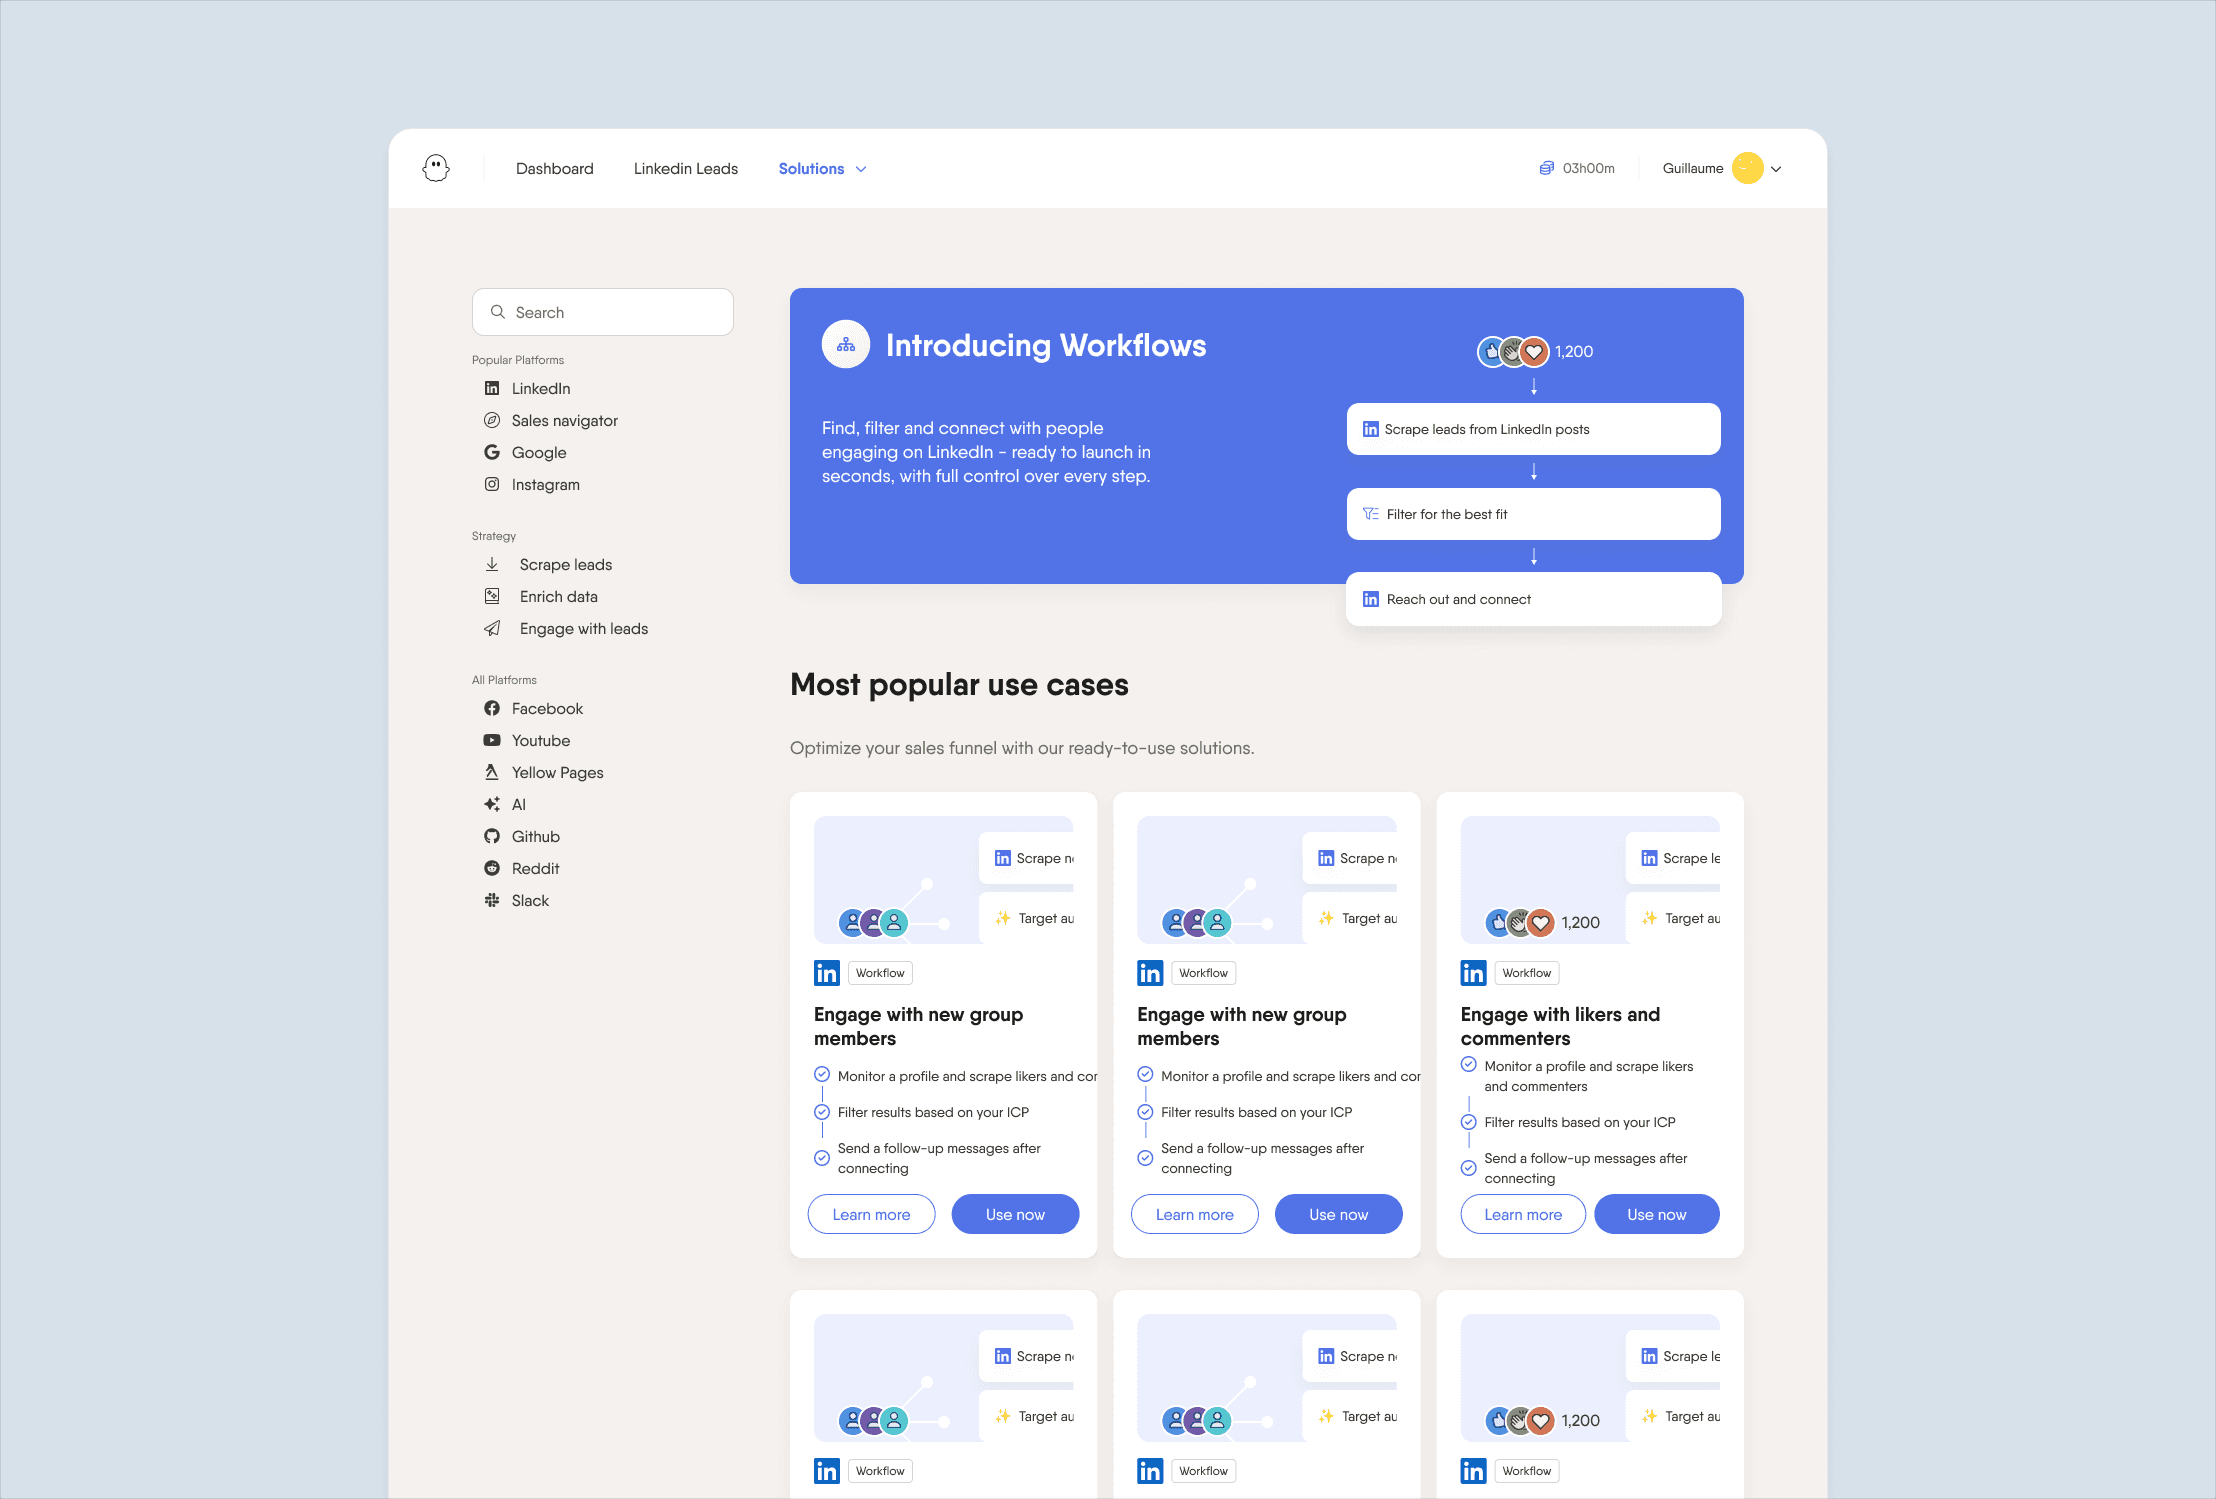
The existing Solutions page presented a flat grid of 50+ workflow cards with no guidance, meaning users had to already know what they were looking for
Power users who stayed had typically discovered complementary automations through trial and error or CS support, not through the product itself
Users expressed that they wanted the product to recommend what to do next based on their goals and tech stack
The Design Challenge
How might we help users discover and set up a second automation that's relevant to their goals, so they experience the full value of the platform before deciding to cancel?
What I Designed
Before: The flat grid
The existing Solutions page showed every available workflow in an undifferentiated 3-column grid. There was a sidebar with platform filters and a search bar, but no guidance for users who didn't already know what they wanted. The "Introducing Workflows" banner at the top promoted the feature broadly but didn't help with specific next steps.
After: Guided discovery
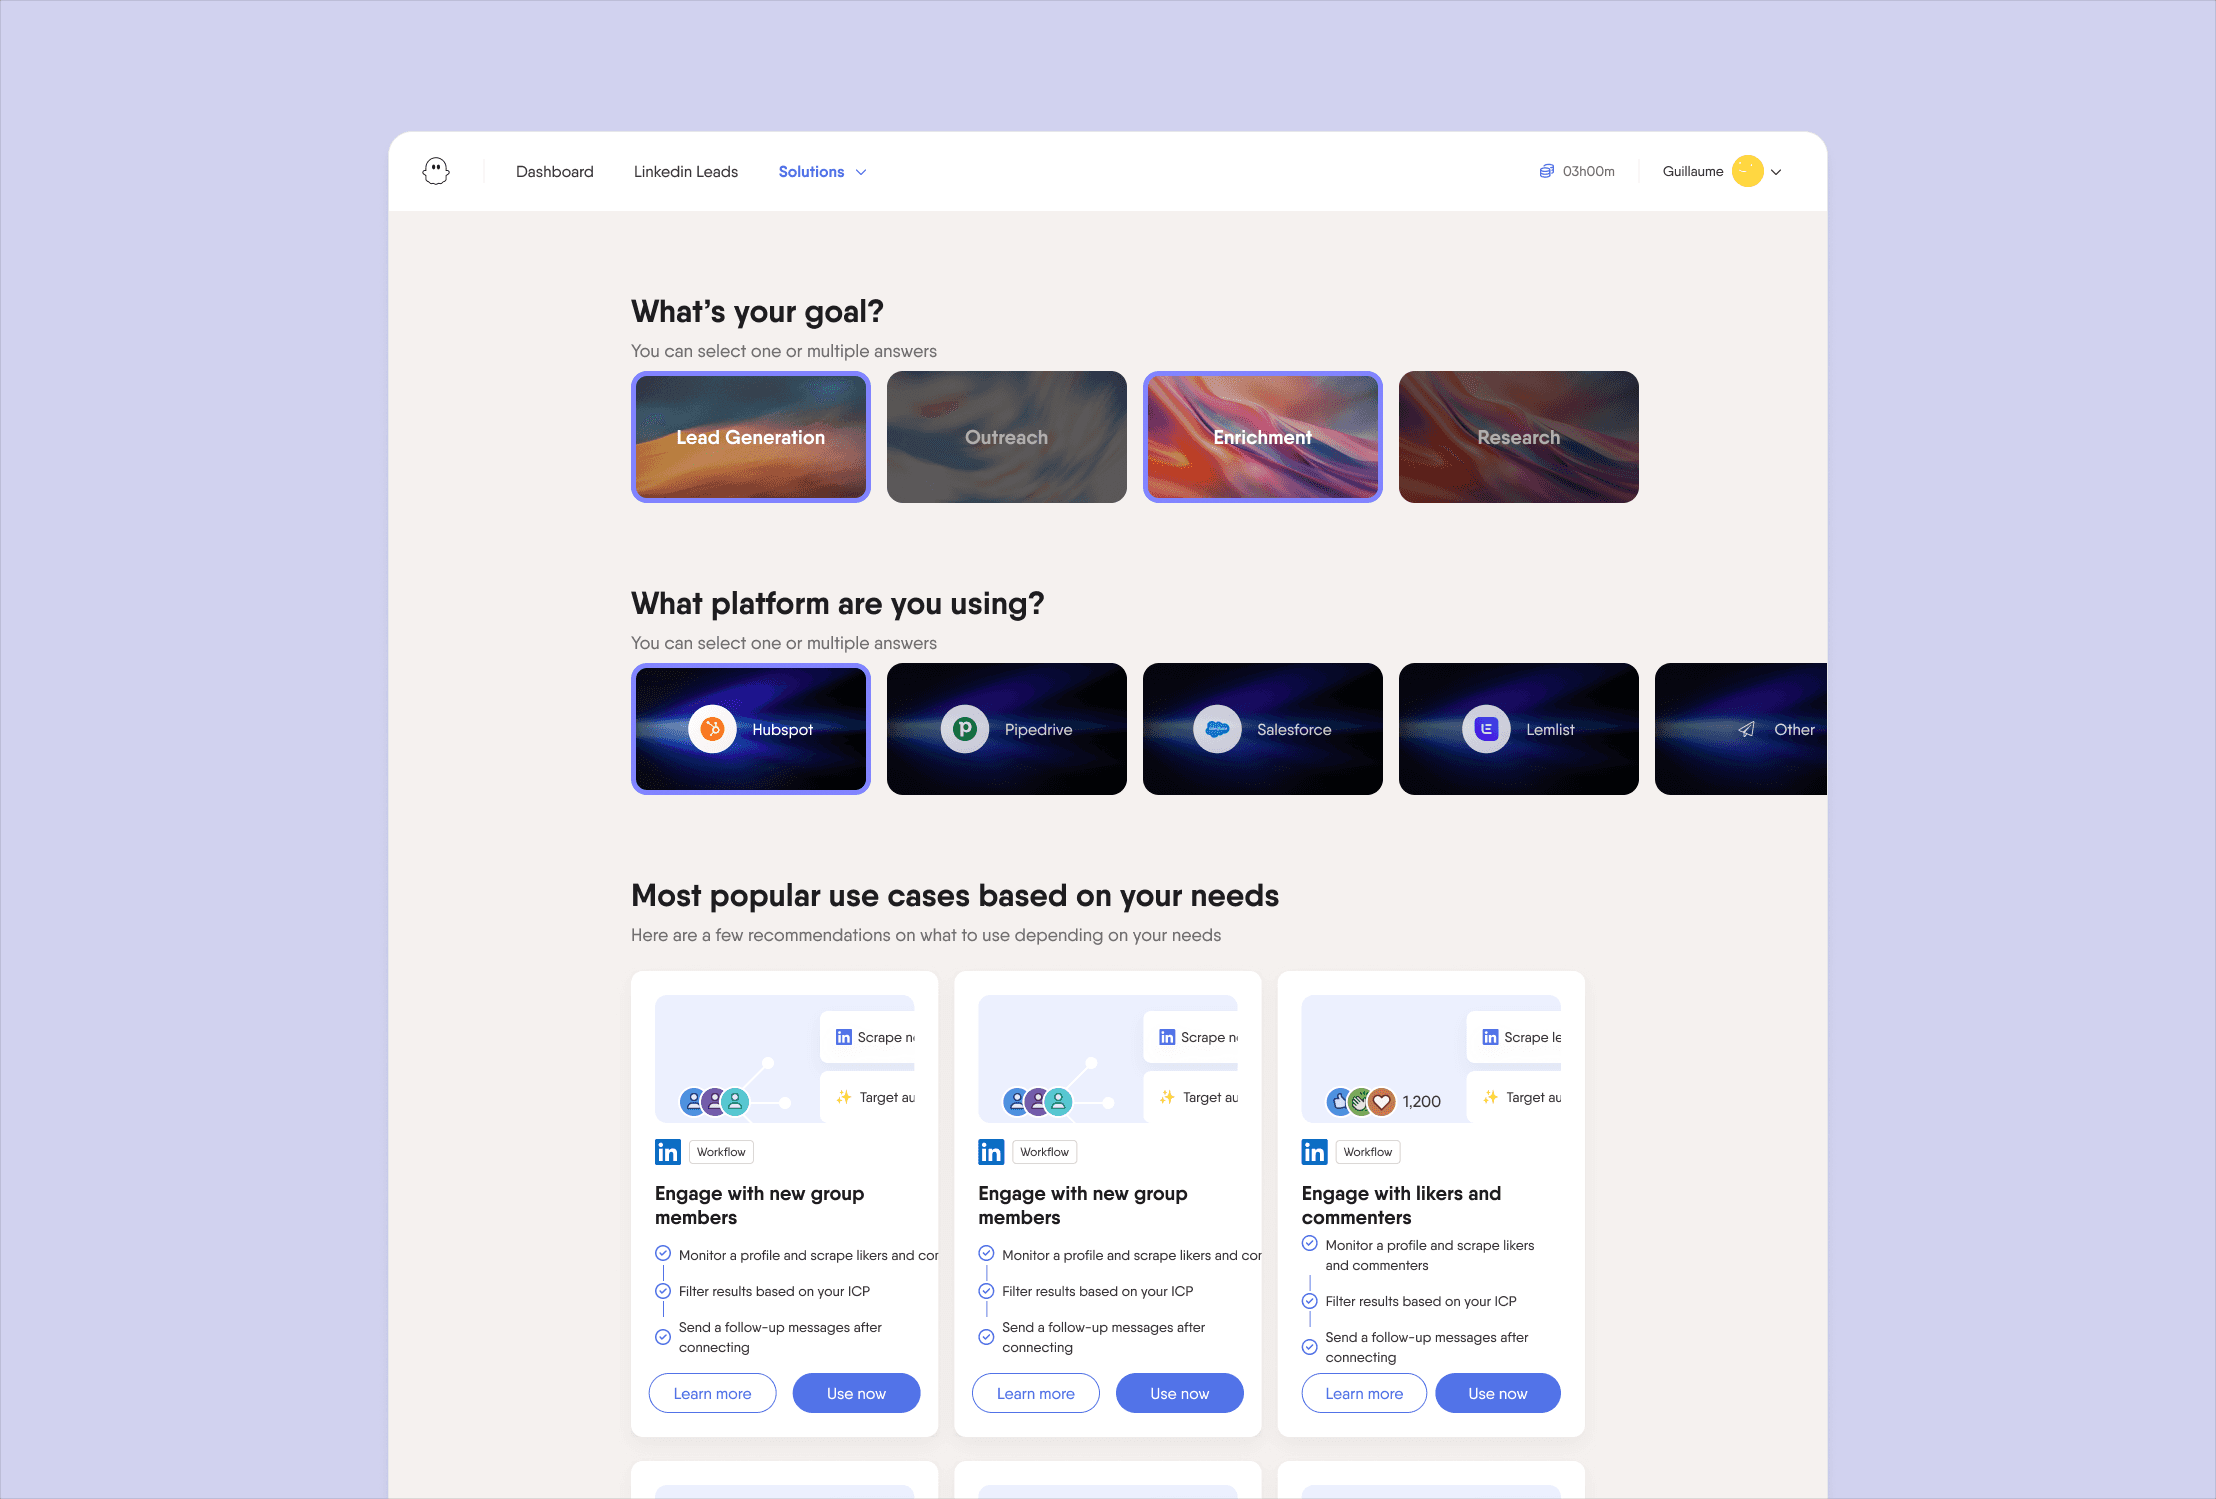
I redesigned the Solutions experience around a two-step guided flow:
Step 1. Intent capture: Instead of dumping users into a catalog, the new page opens with two simple questions: "What's your goal?" (Lead Generation, Outreach, Enrichment, Research) and "What platform are you using?" (HubSpot, Pipedrive, Salesforce, Lemlist, etc.)
Step 2. Personalized recommendations: Based on selections, the page displays a curated set of "Most popular use cases based on your needs" — dramatically reducing the number of options from 50+ to a focused set of 3-6 relevant workflows.
Key design decisions
Progressive disclosure over information density. Rather than showing everything at once, I broke the experience into a clear sequence: express intent → receive tailored options. This reduced cognitive load and made the next step feel obvious rather than overwhelming.
Goal-first framing. By leading with "What's your goal?" instead of "Browse automations," we shifted the mental model from catalog browsing to problem-solving. This mirrors how users actually think: they don't want a "LinkedIn Profile Scraper", they want to generate leads.
Platform context. Asking about their existing tools served two purposes: it improved recommendation relevance, and it signaled that Phantombuster integrates with their stack, addressing the "didn't find what I needed" churn reason.
Reduced choice paralysis. Going from a grid of 50+ cards to 3-6 personalized recommendations made the decision to try a second automation feel low-effort rather than research-intensive.
Results
Churn reduction
Weekly plan cancellations decreased from an average of ~462/week (Oct 2025) to ~419/week (Mar 2026), a 9.4% reduction sustained over six months. The lowest single week reached 346 cancellations, showing the floor the improvements could reach.
This downward trend tracked closely with the statistical trendline in Amplitude, confirming the improvement was sustained and not just noise.
MRR stabilization
Total MRR remained stable around €1M throughout the period, despite seasonal dips (a typical Dec–Feb trough brought MRR to €918K in February before recovering to €1.03M in March). The work was primarily about protecting existing revenue, preventing the churn rate from eroding the base.
Second phantom adoption
The headline metric. The rate at which users who created their first automation went on to create and successfully run a second one jumped from 27.1% in October 2025 to a sustained average of 39.0% from November 2025 through March 2026 — a +44% relative improvement (+11.9 percentage points).
The biggest jump happened immediately after launch: October's 27.1% leapt to 41.9% in November. The rate then settled into a stable range of 36–39%, confirming the improvement was durable rather than a novelty effect.
Month | 2nd Phantom Activation Rate |
|---|---|
Oct '25 | 27.1% (baseline) |
Nov '25 | 41.9% (peak) |
Dec '25 | 39.0% |
Jan '26 | 38.7% |
Feb '26 | 39.4% |
Mar '26 | 36.0% |
Churn reason shifts
The top churn reasons remained structurally similar, but notably, "Bugs/Issues" (193 mentions) and "Went for competitor" (142 mentions) stayed low, confirming that the churn problem was about value perception and discoverability rather than product quality. The guided discovery work directly targeted the largest categories: users who felt they didn't need the product anymore or couldn't find what they needed.
What I Learned
Retention is a design problem, not just a pricing problem. The churn data initially looked like a business issue, with users leaving because of cost or changing needs. But the root cause was a UX gap: the product wasn't helping users discover its full value. Design had a direct role to play in making the product feel essential rather than optional.
The best retention intervention happens before the user considers leaving. Rather than optimizing the cancellation flow (a common approach), we focused on creating value from the start, making it easy for users to go from one automation to two. This is harder to measure in the short term but more durable.
Small interaction design changes can have outsized business impact. The guided discovery redesign wasn't a massive product overhaul. It was a focused change to one page with two new questions and a filtered results view. But because it sat at a critical moment in the user journey (right when users are deciding "what's next?") it had a meaningful effect on retention.
Metrics sourced from Amplitude analytics for Phantombuster (Oct 2025 – Mar 2026). Churn is measured as unique "org plan canceled" events per week. MRR is calculated from ProcessOut transaction data aggregated by plan.
More